LTFR. TRFR. HRFR. Auto-calculated.
Stop hand-building your monthly safety numbers. Lost-time, total-recordable and high-risk frequency rates calculated automatically from the incidents your team logs and the worked hours you enter. Board-ready dashboard, per-site rollup, one-click Excel export. No more spreadsheet maintenance.
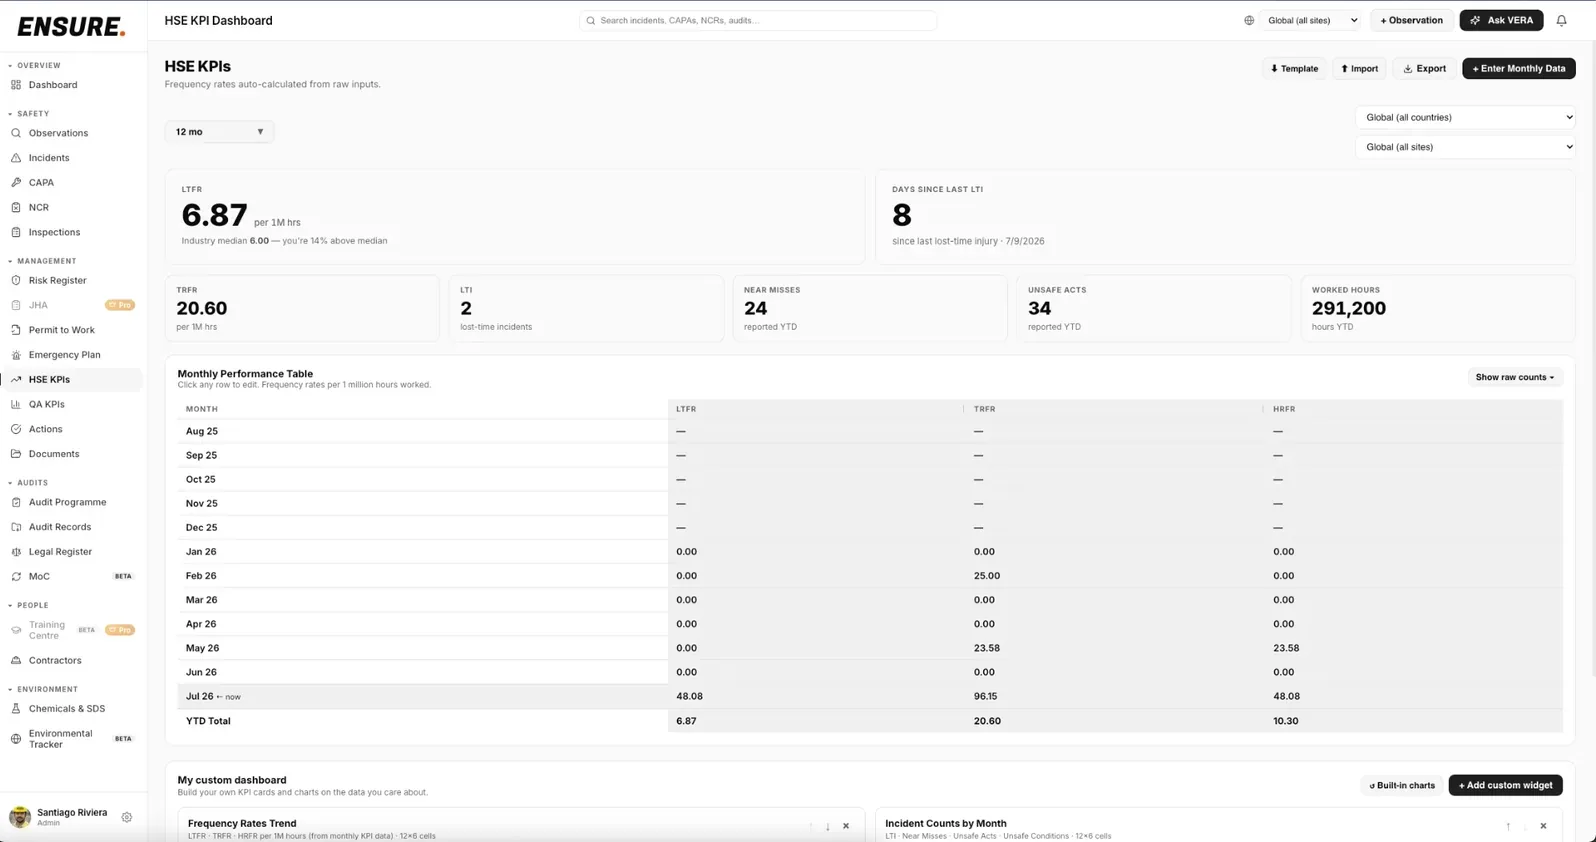
HSE KPIs in ENSURE. LTFR and TRFR calculated from your logged incidents, not a spreadsheet.
Your HSE Manager spends 3 days a month copying numbers into Excel.
Every CFO and CEO wants the LTFR / TRFR / HRFR on the monthly board pack. Most HSE Managers still calculate them by hand from incident logs and a worked-hours spreadsheet. ENSURE already holds your logged incidents. Enter the month's worked hours and it does the maths for you.
Auto-calculated from your data
LTFR = LTI × 1,000,000 / hours worked. TRFR for total recordable. HRFR for high-risk. Per site, per month, per quarter, year-to-date. The numbers refresh from your logged incidents every time you open the dashboard: no formulas to maintain.
- LTFR / TRFR / HRFR · per site · per period
- Rates refresh automatically from logged incidents
- Configurable rolling window (3 / 6 / 12 months)
Board numbers, ready every month
Headline rates and a 12-month trend chart per KPI, in one place. Export the whole dataset to Excel in a click: same numbers, same shape, every month, no recreation.
- 12-month trend chart per KPI
- One-click Excel export of every KPI and raw count
Per-site rollup
Filter to any site, or roll every site up into one org-wide view. Switch scope and the whole dashboard, rates and table recompute for that site with the same KPIs. Spot your worst performer without exporting a thing.
- Filter the dashboard to any single site
- Roll every site up into one org-wide view
The data your board sees comes from the data your team logs.
Every incident, every worked-hours upload, flows into the KPI on the dashboard. No spreadsheets in between.
The CFO wants the KPI on Monday. Have it ready Sunday.
Auto-calculated rates, one-click Excel export, per-site rollup. Book a 30-minute demo and we'll walk it through on your workflow.